


服务热线
178 0020 3020
CMplot这个R包是绘制SNP密度、曼哈顿图和QQ图的一个很实用的R包, 今天分享给大家,下边具体来看看。
安装
install.packages("CMplot")参数释义
Pmap 输入数据文件col 设置颜色,可以是vector or matrix#当vector数量少于染色体数目时,循环利用;也可以对每一个性状的每一条染色体进行设置bin.size 设置SNP密度图中的窗口大小bin.max bin中SNP数量的阈值,当大于阈值时染色体bin颜色为同一颜色cex 设置绘制点的大小 pch 设置绘制点的形状,同plot中的"pch"band 设置染色体之间的间隔,当为0时染色体间无空隙,默认为1cir.band 设置不同circle的空隙,默认为1H 性状circle的高度设置,默认1ylim 设置y轴的范围同plot中的"ylim"cex.axis 设置坐标轴字体和标签字体的大小bin.size 设置SNP密度图中的窗口大小cex.axis 设置坐标轴字体和标签字体的大小plot.type 设置不同的绘图类型,可以设定为 "d", "c", "m", "q" or "b"# "d" 表示 SNP density plot "c" 表示 circle-Manhattan plot# "m" 表示 Manhattan plot "q" 表示 Q-Q plot# "b" 表示 circle-Manhattan, Manhattan and Q-Q plots一起绘制# plot.type=c("m","q") 表示Manhattan plot和Q-Q plot一起绘制multracks 设置是否需要绘制多个trackcex 绘制点的大小,可是为单个数值或向量(对应同一绘图中不同的plot)r 设置圈的半径大小xlab 设置x轴标签ylab 设置y轴标签outward 设置点的朝向是否向外threshold 设置阈值并添加阈值线threshold.col 设置阈值线的颜色threshold.lwd 设置阈值线的宽度threshold.lty 设置阈值线的类型amplify 设置是否放大显著的点chr.labels 设置染色体的标签signal.cex 设置显著点的大小signal.pch 设置显著点的形状signal.col 设置显著点的颜色singal.line 设置显著线的宽度chr.den.col 设置SNP密度图的颜色cir.band 设置环状曼哈顿图中不同染色体之间的间隔cir.chr 设置是否显示染色体的边界cir.chr.h 设置染色体边界的高度chr.den.col SNP密度的颜色,可以为字符,向量或空cir.legend 设置是否显示图例cir.legend.cex 设置图例字体的大小cir.legend.col 设置图例的颜色LOG10 设置是否对p-value取log10对数box 曼哈顿是否绘制方框conf.int.col 设置QQ图中置信区间的颜色file.output 设置是否输出图片file 设置输出图片的格式,可以设定为"jpg", "pdf", "tiff"dpi 设置输出图片的分辨度memo 设置输出图片文件的名字
绘图
绘制SNP密度图
CMplot(pig60K,plot.type="d",bin.size=1e6,col=c("darkgreen", "yellow", "red"),file="jpg",memo="",dpi=300,file.output=TRUE, verbose=TRUE)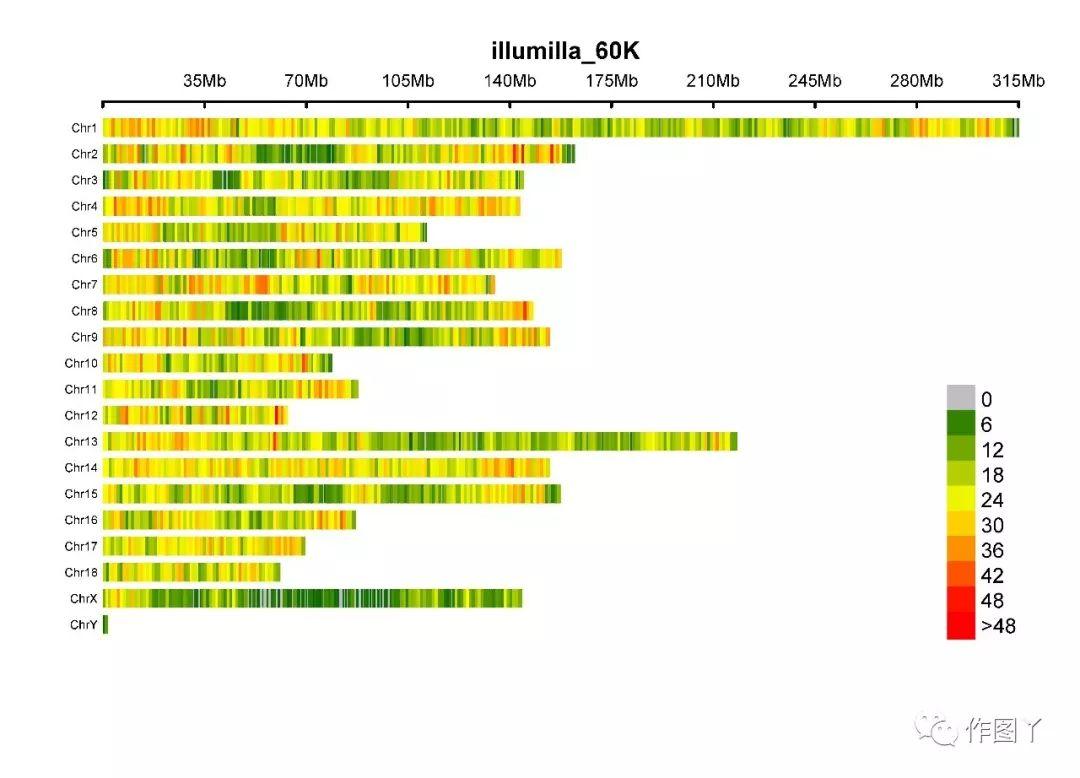
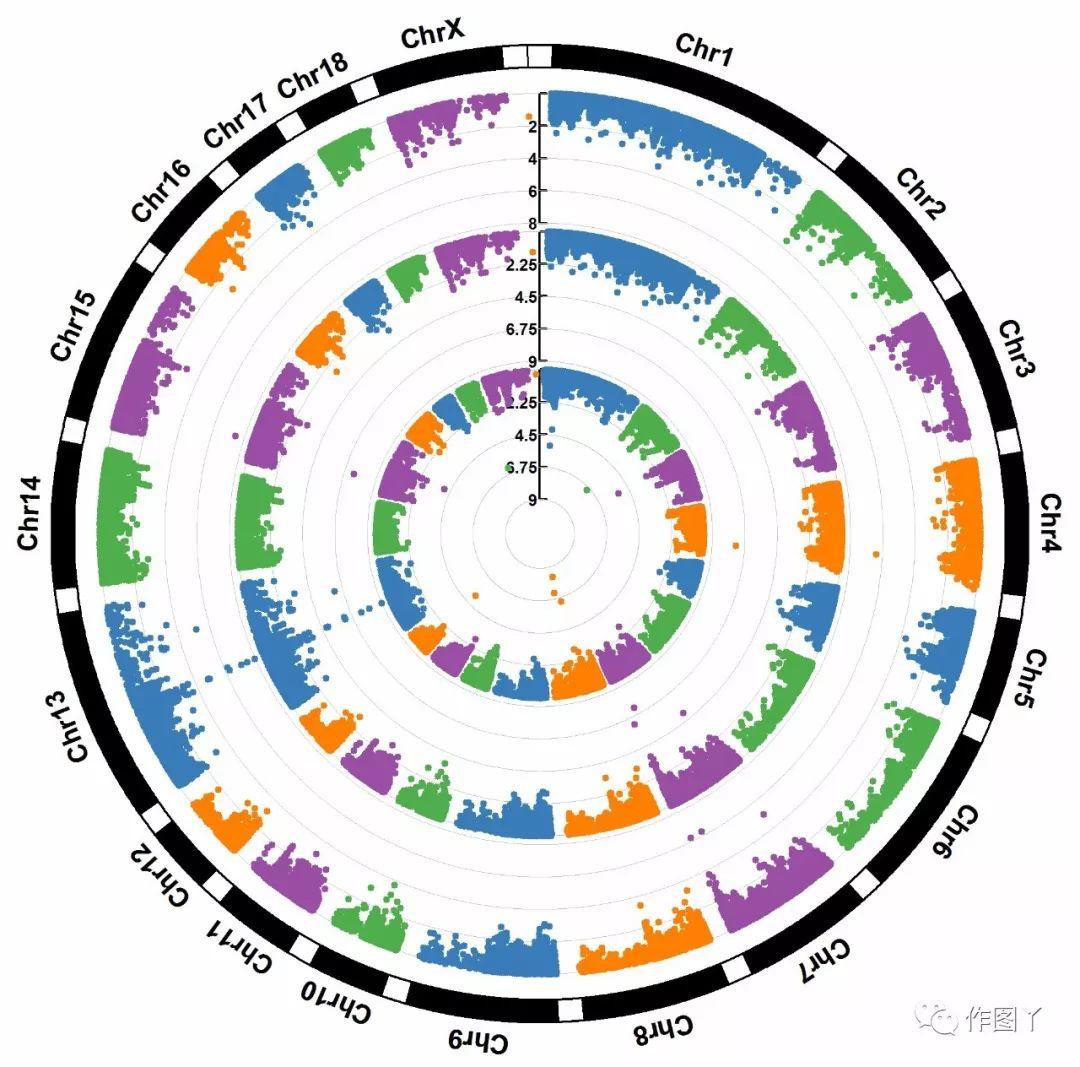
绘制环形曼哈顿图
CMplot(pig60K,plot.type="c",chr.labels=paste("Chr",c(1:18,"X"),sep=""),r=0.4,cir.legend=TRUE, outward=FALSE,cir.legend.col="black",cir.chr.h=1.3,chr.den.col="black",file="jpg", memo="",dpi=300,file.output=TRUE,verbose=TRUE)
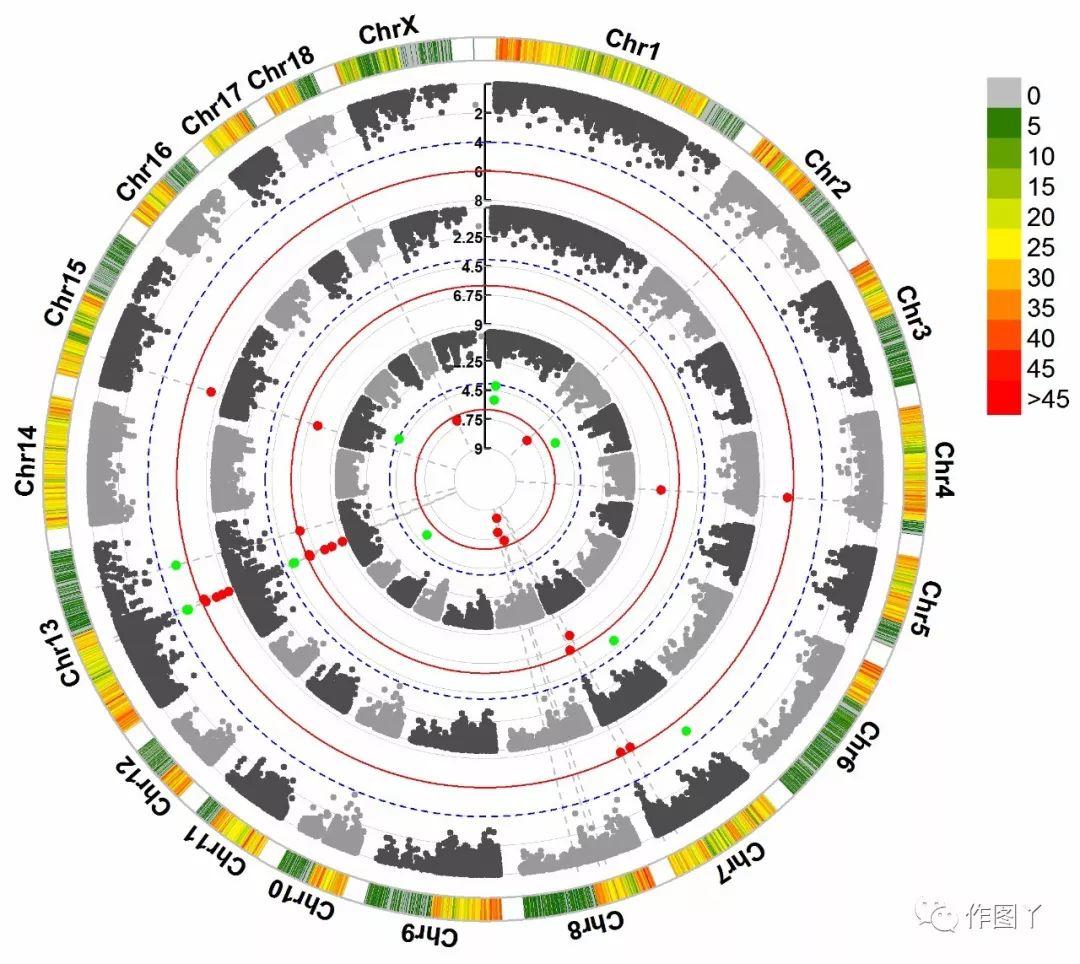
CMplot(pig60K,plot.type="c",r=0.4,col=c("grey30","grey60"),chr.labels=paste("Chr",c(1:18,"X"),sep=""), threshold=c(1e-6,1e-4),cir.chr.h=1.5,amplify=TRUE,threshold.lty=c(1,2),threshold.col=c("red", "blue"),signal.line=1,signal.col=c("red","green"),chr.den.col=c("darkgreen","yellow","red"), bin.size=1e6,outward=FALSE,file="jpg",memo="",dpi=300,file.output=TRUE,verbose=TRUE)
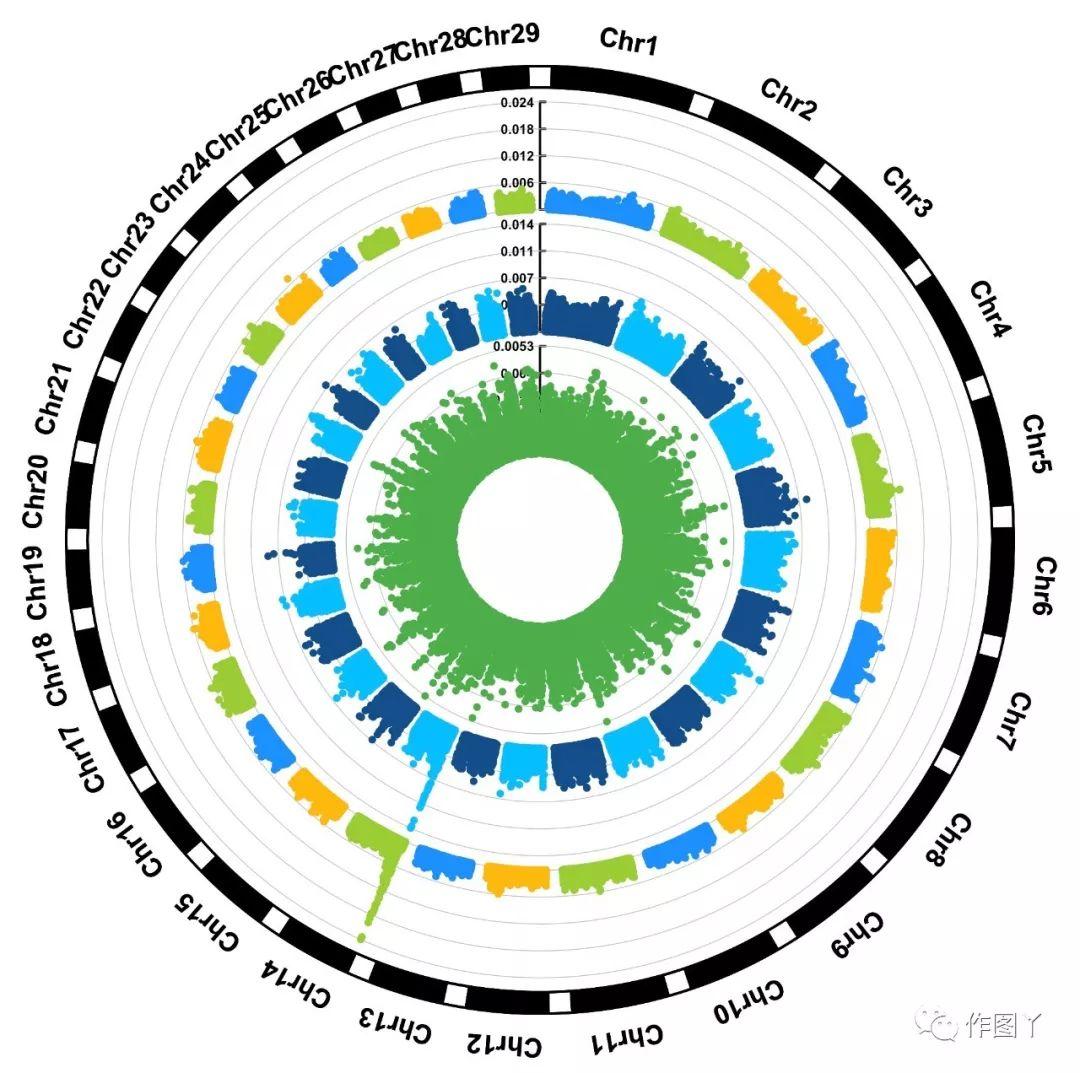
CMplot(cattle50K,plot.type="c",LOG10=FALSE,outward=TRUE,col=matrix(c("#4DAF4A",NA,NA,"dodgerblue4", "deepskyblue",NA,"dodgerblue1", "olivedrab3", "darkgoldenrod1"), nrow=3, byrow=TRUE), chr.labels=paste("Chr",c(1:29),sep=""),threshold=NULL,r=1.2,cir.chr.h=1.5,cir.legend.cex=0.5, cir.band=1,file="jpg", memo="",dpi=300,chr.den.col="black",file.output=TRUE,verbose=TRUE)
CMplot(pig60K,plot.type="m",LOG10=TRUE,threshold=NULL,chr.den.col=NULL,file="jpg",memo="",dpi=300, ,file.output=TRUE,verbose=TRUE)

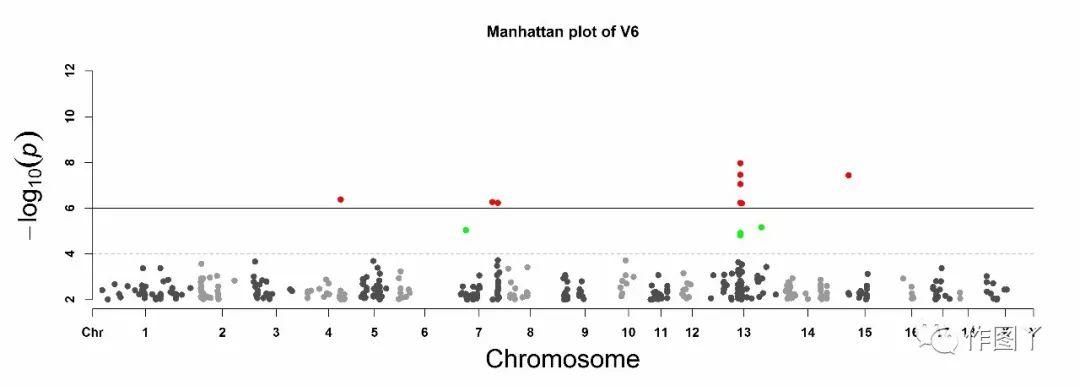
CMplot(pig60K, plot.type="m", col=c("grey30","grey60"), LOG10=TRUE, ylim=c(2,12), threshold=c(1e-6,1e-4), threshold.lty=c(1,2), threshold.lwd=c(1,1), threshold.col=c("black","grey"), amplify=TRUE, chr.den.col=NULL, signal.col=c("red","green"), signal.cex=c(1,1),signal.pch=c(19,19), file="jpg",memo="",dpi=300,file.output=TRUE,verbose=TRUE)
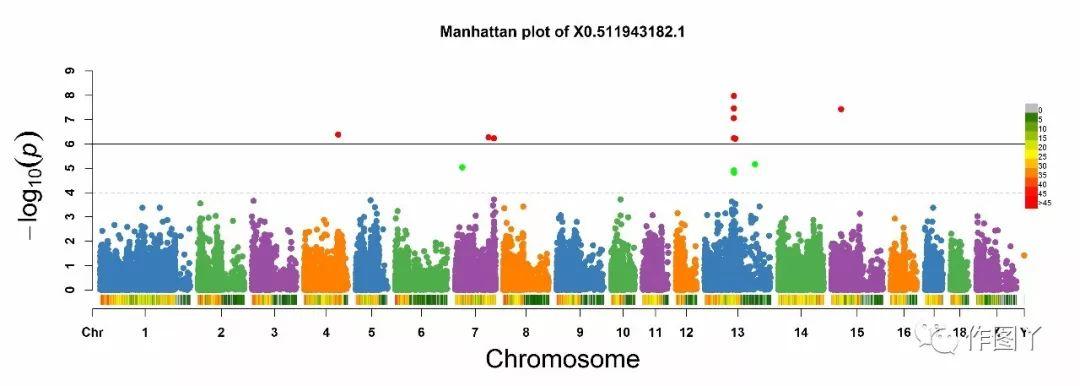
CMplot(pig60K, plot.type="m", LOG10=TRUE, ylim=NULL, threshold=c(1e-6,1e-4),threshold.lty=c(1,2), threshold.lwd=c(1,1), threshold.col=c("black","grey"), amplify=TRUE,bin.size=1e6, chr.den.col=c("darkgreen", "yellow", "red"),signal.col=c("red","green"),signal.cex=c(1,1), signal.pch=c(19,19),file="jpg",memo="",dpi=300,file.output=TRUE,verbose=TRUE)
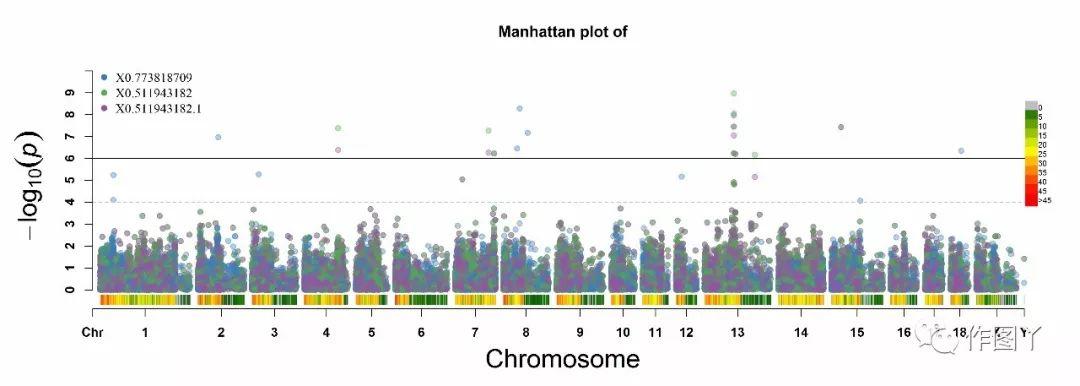
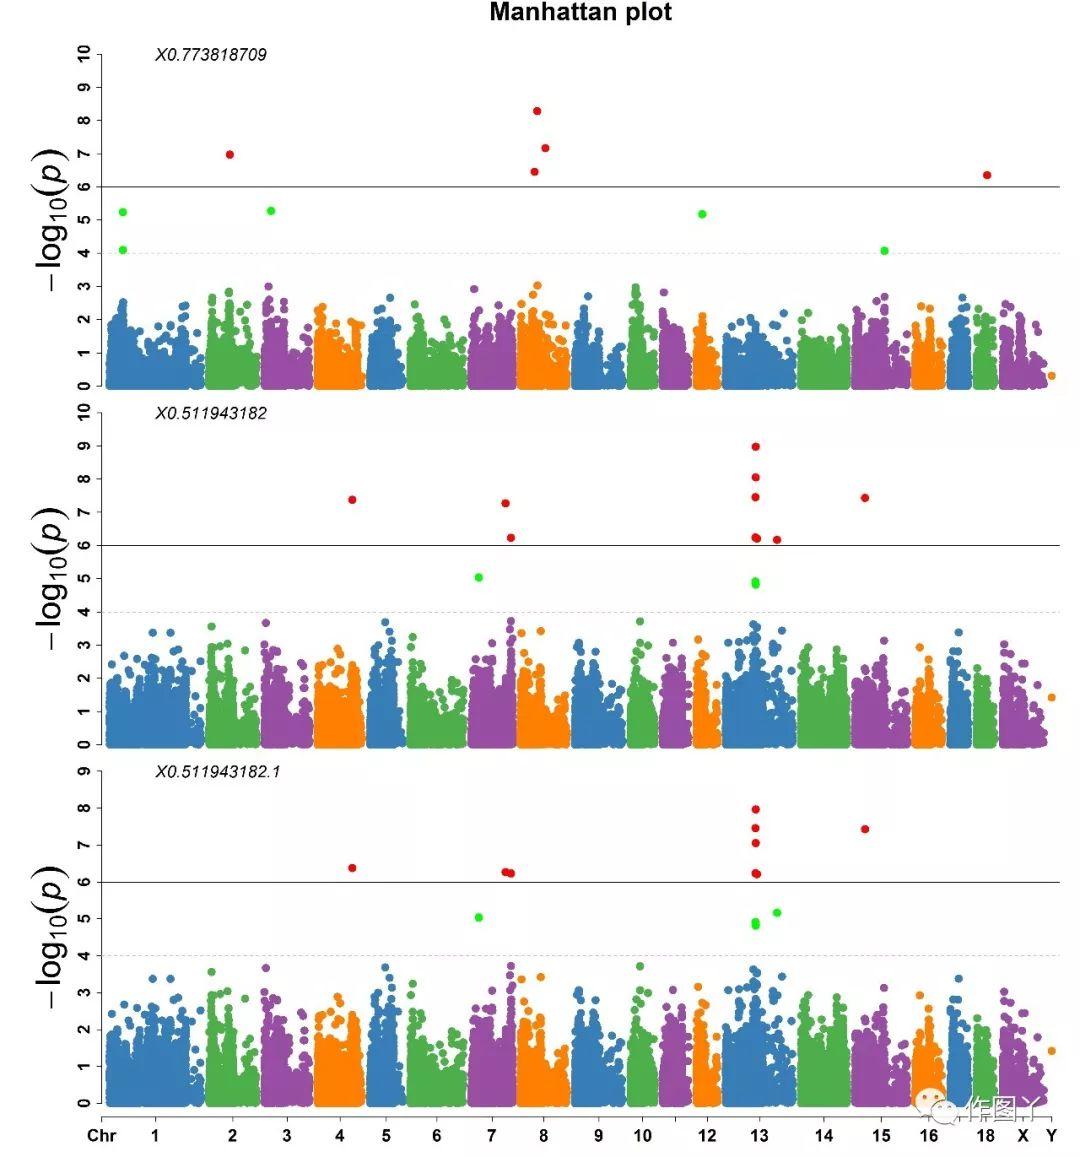
CMplot(pig60K, plot.type="m", multracks=TRUE, threshold=c(1e-6,1e-4),threshold.lty=c(1,2), threshold.lwd=c(1,1), threshold.col=c("black","grey"), amplify=TRUE,bin.size=1e6, chr.den.col=c("darkgreen", "yellow", "red"), signal.col=c("red","green"),signal.cex=c(1,1), file="jpg",memo="",dpi=300,file.output=TRUE,verbose=TRUE)a.所有性状在同一坐标系内
b.分坐标系性状绘图
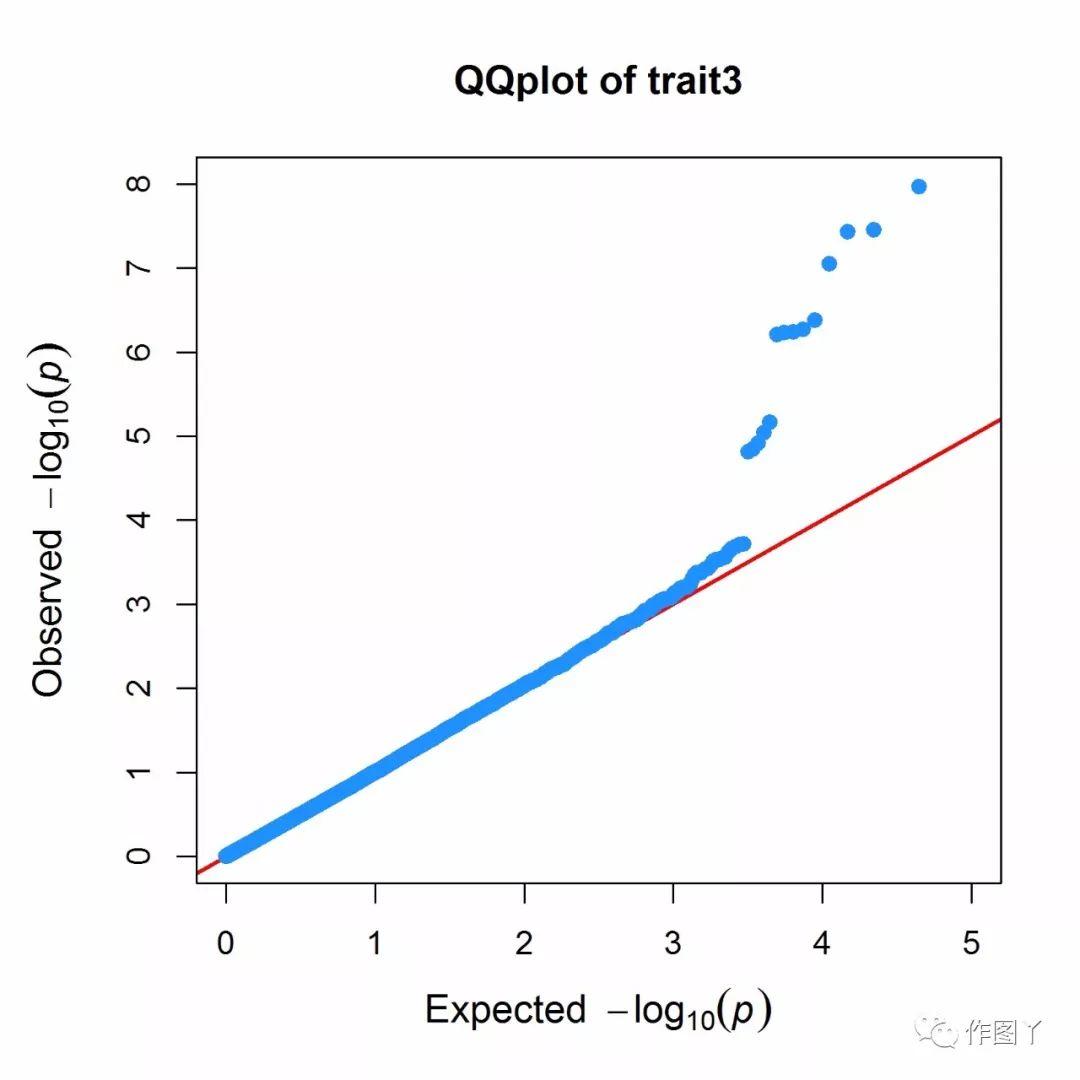
CMplot(pig60K,plot.type="q",conf.int.col=NULL,box=TRUE,file="jpg",memo="",dpi=300, ,file.output=TRUE,verbose=TRUE)
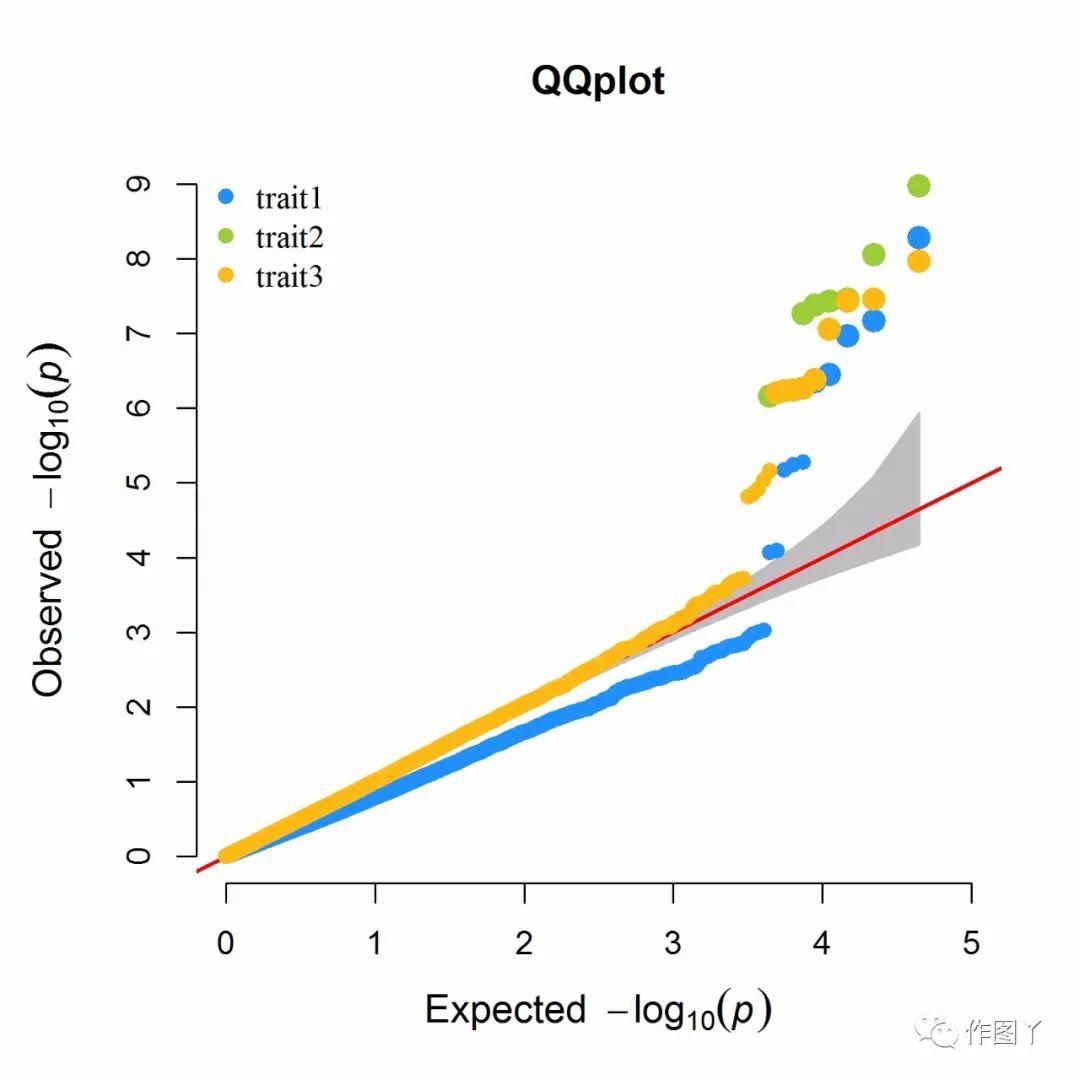
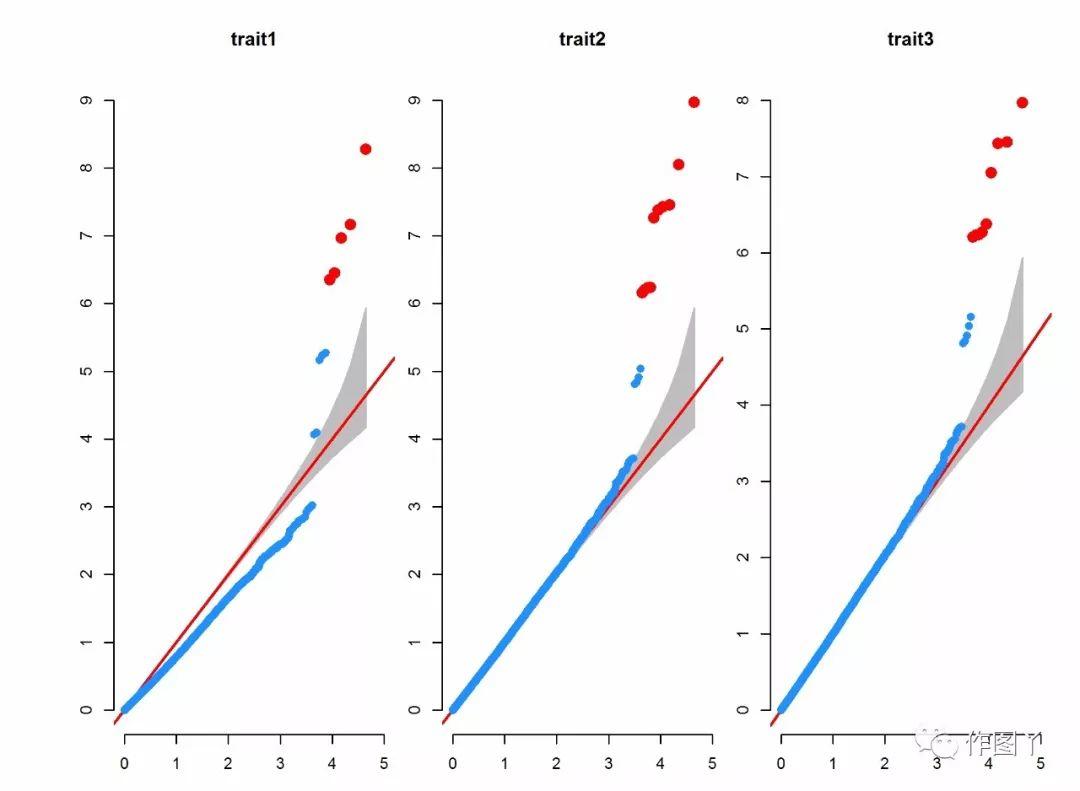
CMplot(pig60K,plot.type="q",col=c("dodgerblue1", "olivedrab3", "darkgoldenrod1"),threshold=1e6, signal.pch=19,signal.cex=1.5,signal.col="red",conf.int.col="grey",box=FALSE,multracks= TRUE,file="jpg",memo="",dpi=300,file.output=TRUE,verbose=TRUE)a.所有性状在同一坐标系内
b.分坐标系性状绘图
CMplot包是不是很实用和容易掌握呢?,不管怎样测试测试再说!

附件